The purpose of this document is to show how the Geometron meta-language can be used to construct the artistic tools required to communicate ideas about quantum computing from one human to another.
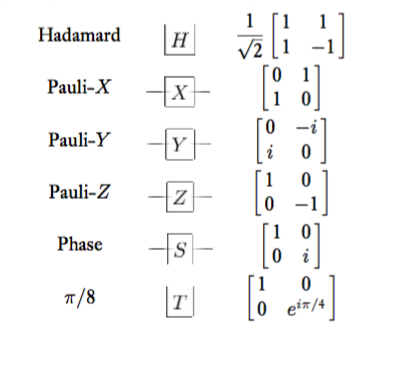
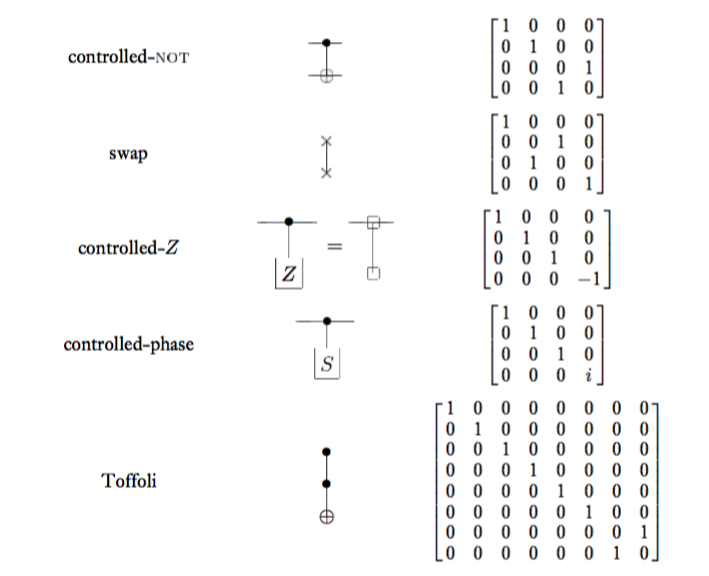
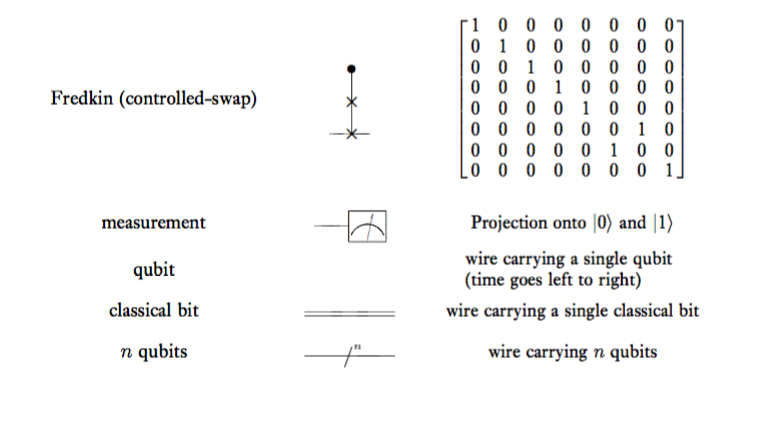
Shown below are screenshots from a electronic copy of "Quantum Computation and Quantum Information", by Nielson and Chaung, which is the closest thing quantum computing has to a definitive reference book. This is the list of symbols given in the introduction, and it's used fairly universally as a guide for graphical descriptions of quantum computation operations.
Illustrator doesn't know what LaTeX is and Tex doesn't know what a line is
tables with mathjax elements and geometron elements show power of html
export to svg can go to illustrator, web, powerpoint, latex, markdown, gds2, email
geometron engine can connect Quil or other quantum code with graphics instantly in real time, which can be manipulated to be useful also in real time
The following is a reproduction of the table from Nielson and Chuang, but with everything built in html. It is an html table, where each mathematical expression is represented with LaTeX, typeset using the Mathjax javascript library, and all the symbols are created using the Geometron geometrical language which I am advertising here.
All that was in the canvas elements in html. I now want to investigate what can be done in svg elements.
.svg code ready for copy/paste:
And another example:
Issues to Address
smoothly integrate into latex documents for papers
smoothly integrate into Powerpoint and Keynote for presentations
be easily and transparently modified and republished by other researchers so the symbol vocabulary can evolve and specialize as needed
Convert with some automation between geometron code for symbols and executable quantum processor code such as Quil from Rigetti Computing
Have joined line segments in paths that avoid weird looking breaks
Be clearly enough documented that everyone in the field can get minimal literacy in the system with minimal levels of effort
Close the hardware loop by including .svg data which describes microfabricated devices, and embedding the code that describes those devices in the device itself in metal-on-silicon using Roctal encoding
Apparently the new versions of Office let you directly import an svg file(after 17 years of Microsoft dragging their feet on this obvious, useful and simple feature). Illustrator also takes svg's directly, and including them in Latex is a commonly done operation that users are presumably already familiar with. Thus the main task for latex, powerpoint etc. is to get the svg exportable code to have the proper top and bottom tags to be easy to read by all programs, that's the first next thing to do.
Being easy to modify and building a remix culture where QI researchers are constantly updating and maintaining the library is all about two things: good help files, and good book keeping. I think the path to the first of these is to just write it and start bugging people in the field to try it out and debug the docs to the point that they find it non-frustrating. The path to the second is to target the huge groups who already employ front end web people, and pitch this as a marketing type project to make their web site look better. That means private sector groups, which rely on PR for survival and have pretty looking websites. The ideal "customer" is a organization that already has a information pipeline between the front end web people who know javascript and the quantum information researchers who are constantly trying to get the outside world to care about their work. Initially this software will mainly be used to smooth out this pipeline.
The closing of the hardware loop is not needed for deployment in the community but I personally need it for the documentation on SQUID and tunnel junction stuff that I'm writing up now. I really want to do this but it's not needed for this project, I'll deploy it in the other projects.
The Plan
Write an academic-ish paper documenting the idea and the implementation
Create standard documentation online with a coherent github repository so that it's smooth to get new people to start it
Make fully live examples where users can create their own gate diagrams online and extract the .svg without even downloading or editing anything--just edit in the browser and copy-paste into a text file and save as .svg
Academic paper must address the concept of the "art stack" in computer science, the importance of human-to-human graphical communication in the actual functioning of the physical processor
Create some type of online forum where users can communicate and share/build this thing, preferably on Github so that I don't have to build a whole system
Things I want to get done that are not needed to demonstrate the basic system but which are useful/important:
classical gates, all of them
flowchart constructor
digraph constructor
online electronic lab notebook
Upon further consideration, some of these are not optional for later. I need the words-in-boxes code to work now in order to write the publication and documentation for the basic quantum geometron instance. How would I describe the "art stack" without those kinds of figures? It must be done now. Also, solving the problems of getting things into gds is the same as solving the problems of getting it into clean enough svg that it can be exported easily to publication quality work. And finally building the basic lab notebook functionality is needed to make the paper-creation process smooth enough that people will use it. Also, it seems wrong to write this paper in anything but that, so that must be written(code to build technical communication in real time using geometron) to do this(write the paper).
A Study of Closed Boxes
Now it is time to carefully construct nice looking closed, but not filled, boxes which might or might not have circular arcs as part of them. I start by working with the square and comparing the basic square I use for all the symbol glyphs with the closed square required for publication quality vector graphics.
Here is the not closed square in a canvas element, blown up so that the flaws are visible.
Look at those ugly corners!! When blown up like this and set alone in a canvas it might look like an intentional effect to generate some kind of retro pixel game graphics, but in a technical diagram for publication, presenting this as a "square" should be unacceptable at any scale. To understand the problem I must show the code that made this. It is the shape I put at 0200 in the shape table, which is used for all symbol glyph containers. It's bytecode is, in Geometron format:
The square as used in the standard symbol glyphs is made up of discrete segments, each of which is terminated at each end. In canvas these segments are built with the following code:
The line in the svg for one of these might look like this:
< line x1="212" y1="168" x2="194" y2="168" style="stroke:black;stroke-width:2"> < /line>
To make this square into a single entity we need to extend the path element in canvas into multiple operations of the main Geometron function, and in the svg we need to switch from "line" to "path". The path element in svg uses very efficient but also opaque nomenclature which must be deciphered to make this a transparrent function. Also, in both the svg and the canvas we need to use another two fundamental Geometron operations, the begin and end path operators. Finally to make it faster to build useful closed loops we need to add elements to the shape table which both draw and move at the same time, which will be symbolized by arrows in the command shape table. Here are the symbols for those:
So to make a square, combining the above spellings, would be:
where
The issue which requires great care here is distinguishing when an action is in a path and when it isn't. Circles and dots are always self-contained entities. Therefore in terms of fundamental drawing actions, this means line segments and arcs(of less than \(2\pi\)). There are two basic ways to do this. One is to use a separate command for line segments in a path than line segments on their own. In this case the symbol for line segment is modified for maximum clarity to give:
Or, in octal bytecode:
0201:0344,0330
The other method of dealing with this is to add a global boolean variable called inPath, which is set to false in the initialization then again in the end path command 0363 and to true in the start path command 0362. While this is in some ways more complicated, as if statements must be added inside 0342 and 0343, it has the advantage that bytecode can be more easily recycled from a version made of all self contained line segments when it's transformed into a cleaner path-based version. In some sense this shows the strength of the Geometron approach. By making the code easy to understand and expecting all users to edit all aspects of it from scratch in every instance, it is easy to make the code behave exactly correctly for each specific application.
Similarly, the command to end a path given by 0363 can be modified inside the function doTheThing(localCommand) by the user every time to decide how and if closed paths should be filled. In general fill properties are modified by the commands in the 032x row but in many cases a whole Geometron instance will use a single type of fill(or lack thereof) and it makes sense to at least take a look at what is in 0363 each time to be sure it's right.
With that excessive digression, I now ask what is the exact right implementation for quantum computing theory and design? By default, nothing should be filled, and all line segments should be part of a path which is manually started and ended to make it export well. There are also times where it clearly makes sense to have a self contained line segment be easily usable, as in the definition of the various swap gates. Thus the default should be no fill, filled circle will be a special case from empty circle and will be at address 0367, and there will be two types of line segment, with symbols as defined above. To avoid any degeneracy in notation, 0201 will be the isolated segment and 0203 will be segment that is part of a path and 0202 is the cross hatch symbol used to modify the various symbol glyphs to put things in a path. Likewise we need a filled arc, which will be stored at addresses 0345 and 0346 for the two directions of arc(this matters when in a path).
Construction Of First Clean-Format Box
The first thing we need is a closed square to replace the open square. This alone will solve the largest problem here, making the gates publication quality in the svg format. It is now time to make a connected square:
Now to actually try it, first in a canvas element:
That looks good, even with the very wide line width. Now try an svg element.
And here is the result of copy/pasting the above svg code into a .svg file with a text editor then opening it in a gds editor(http://www.layouteditor.net):
This closes the loop with fabrication! It is now possible to directly create a thing in a browser and then move it to .gds format and turn it into metal-on-silicon, or to gerber file format and turn it into copper-on-pcb. This can be used both for direct layout design and more importantly for encoding of information on layouts to track design information in the physical world.
Word-in-Box
Now I will formally introduce the word in a box. Words are inserted into Geometron elements, be they svg or canvas, with the byte code command 0365, denoted by the symbol glyph:
.
What this does is print the global string variable currentWord at location defined by the global variables x and y with font size side. Setting of the value of currentWord is done by invoking a command in the address space from 0600 through 0677, which are defined as the word tablet.
Now for an example of building word-in-box structures using a pair of common icons from quantum information theory, Alice and Bob:
Since some tweaking was required to make this, let's take a closer look at what that tweaking was.
Here is the naive application of the square drawing command and the word command:
Without any extra commands, the square and the text both have size set by the global "side", so they're the same. Also with the same coordinates, the text is outside the box. This is an important application of a fundamental operation in geometron, the shrunken move. Also, we'll use scaling outside the standard doubling. I now jump to a demonstration: